
RESEARCH ARTICLE
Two- and Three-Dimensional Quantitative Structure-Activity Relationships Studies on a Series of Liver X Receptor Ligands
Káthia M Honório*, 1, Lívia B Salum2, Richard C Garratt2, Igor Polikarpov2, Adriano D Andricopulo*, 2
Article Information
Identifiers and Pagination:
Year: 2008Volume: 2
First Page: 87
Last Page: 96
Publisher ID: TOMCJ-2-87
DOI: 10.2174/1874104500802010087
Article History:
Electronic publication date: 7/10/2008Collection year: 2008

Abstract
Liver X receptor (LXR) is an attractive drug target for the development of novel therapeutic agents for the treatment of dyslipidaemia and cholestasis. In the present work, comparative molecular field analysis (CoMFA) and hologram quantitative structure-activity relationship (HQSAR) studies were conducted on a series of potent LXR ligands. Significant correlation coefficients (CoMFA, r2 = 0.98 and q2 = 0.69; HQSAR, r2 = 0.99 and q2 = 0.85) were obtained, indicating the potential of the models for untested compounds. The models were then used to predict the potency of an external test set, and the predicted values obtained from the 2D and 3D models were in good agreement with the experimental results. The final QSAR models, along with the information obtained from 3D steric and electrostatic contour maps and 2D contribution maps should be useful for the design of novel LXR ligands having improved potency.
INTRODUCTION
Nuclear receptors (NRs) are ligand-dependent intracellular transcription factors that have important roles in several biological processes, including cell proliferation, differentiation and cellular homeostasis [1-4]. NRs are implicated in important diseases such as cancer, diabetes, and osteoporosis, and thus have been considered attractive targets for drug discovery and development [5]. Typically, NRs act as ligand-inducible transcription factors, responding to endogenous and exogenous chemicals. However, there are some NRs whose endogenous ligands have not yet been identified and these are known as orphan receptors. The chemical diversity of the NR ligands is considerably high as a natural result of the structural diversity of the protein themselves. For example, endogenous ligands include a diversity of lipophilic compounds such as steroid hormones, thyroid hormone, vitamin D3, fatty acids, eicosanoids, bile acids and oxysterols [6,7]. Therefore, recognition of the importance of NRs as vital regulators of genes involved in metabolic control has resulted in intensive search for novel selective ligands to combat major human diseases and disorders [8].
Liver X receptors (LXRs) form a subgroup of NRs called metabolic receptors, which have attracted increasing interest in medicinal chemistry. The two LXR subtypes α and β (LXRα and LXRβ, respectively) share a high degree of amino acid sequence similarity (78% in their DNA- and ligand-binding domains), but differ substantially in their tissue distribution. LXRα was first identified in the liver, but is also expressed in other metabolically active tissues such as kidney, intestine, adipose tissue, and macrophages. In contrast, LXRβ is ubiquitously expressed [9]. The majority of the LXR target genes appear to have one of two biological functions; firstly, removal of excess cholesterol through efflux, catabolism or decreased absorption; and secondly, synthesis of fatty acids [10,11]. Alterations in cholesterol and fatty acid metabolism play an important role in the development of cardiovascular diseases. The established functions of many of these LXR targets have fueled speculation as to how their pharmacological regulation by LXR ligands might impact metabolic disease.
Integration of structure- and ligand-based approaches have become vital components of modern drug design [12,13]. The main objective of our study was to investigate the quantitative structure-activity relationships (QSAR) of a series of LXR ligands by employing the comparative molecular field analysis (CoMFA) and hologram QSAR methods. The results obtained from the predictive 3D and 2D QSAR models generated in this work should be useful in the design of new LXR ligands. It is interesting to note that the number of QSAR studies concerning the chemical structure and corresponding biological information for NRs is significant, as a result of the SAR available information. However, to the best of our knowledge, the majority of QSAR models reported in the literature is associated with the estrogen receptor (ER) [14,15], while a few other models have been performed for distinct NRs [13,16-18]. This fact shows the importance of further QSAR studies involving other NRs such as LXR, the macromolecular target of our studies.
METHODOLOGY
Data Set
The data set of 20 LXR ligands used for the HQSAR and CoMFA analyses was selected from the literature and consists of oxysterol and tertiary amine derivatives [19, 20]. The generation of the ligand structures, as well as the QSAR modeling analyses, calculations and visualizations were performed using the SYBYL 8.0 package (Tripos Inc., St. Louis, USA).
CoMFA Analyses
In 3D QSAR studies, it is crucial to consider the molecular alignment of the data set ligands, and a variety of useful approaches has been described in the literature for this purpose [12, 13, 18, 21]. In this work, the docking protocol as implemented in GOLD 3.1 (Cambridge Crystallographic Data Centre, Cambridge, UK) was employed to search the possible binding conformations of the ligands into the LXR active site. Initially, the single optimized conformation of each molecule in the data set was energetically minimized employing the atom-centered partial charge AM1-ESP calculations implemented in MOPAC 6.0. The X-ray crystallographic data for LXR in complex with the small molecule agonist (T0901317) used in docking simulations and QSAR simulations were retrieved from the Protein Data Bank (PDB ID 1UPV, with resolution of 2.1 Å) [22]. During the process of structure preparation, the ligand was removed from the complex structure and hydrogen atoms were added using the program Pymol (DeLano Scientific, San Carlos, USA). The active site for the docking simulations was defined considering a radius of 10 Å around the C28 atom of the ligand bound in the X-ray structure. Default parameters and GOLDscore function were employed in all docking runs, and only the best ranked conformation was considered for 3D QSAR studies.
CoMFA analyses also permit to explore the main contributions of electrostatic and steric fields in the intermolecular interactions between the data set ligands and the binding site of the LXR protein. In this context, CoMFA calculates the steric and electrostatic properties according to Lennard-Jones and Coulomb potentials, respectively [23]. Thus, the aligned training set molecules were placed in a 3D grid box of 2.0 Å in the x, y, and z directions, and a grid region was automatically generated by the CoMFA routine to encompass all molecules with an extension of 4.0 Å in each direction. The CoMFA fields were generated at each grid point with Tripos force field using an sp3 carbon atom probe carrying a +1 net charge. CoMFA region focusing method was applied to increase the resolution of CoMFA models. The default value of 30 kcal mol-1 was set as the maximum steric and electrostatic energy cutoff. Minimum-sigma (column filtering) was set to be 2.0 kcal mol-1 in order to improve the signal-to-noise ratio by omitting those lattice points with energy variation below the threshold. All models were investigated using noncross-validated correlation coefficient (r2) and the full cross-validated r2 (q2) partial least squares (PLS) leave-one-out (LOO) method. Leave-many-out (LMO) crossvalidation with 10 randomly selected groups were used as a more rigorous test to assess model stability and statistical significance. Progressive scrambling method was applied to determine the sensitivity of the QSAR models to chance correlations. The CoMFA contour maps were generated by interpolation of the pairwise products between the PLS coefficients and standard deviations of the corresponding descriptors values. External model validation was performed with a test set of compounds, which were not considered for QSAR model generation. After generation of the PLS training set models, the dependent variables (pEC50) were predicted for the test set compounds, allowing predictive-r2 values to be determined for the individual 3D QSAR models.
HQSAR Analyses
Since the integrated information obtained from 2D and 3D methods is recognized as a valuable strategy in drug design [12, 13], we have explored the 2D molecular features related to the potency of this series of LXR agonists. Predictive 2D QSAR models were generated using the HQSAR method, which only requires 2D structures and the corresponding biological activity as input, allowing the investigation of a wide variety of bioactive compounds, even when the 3D biological target information is not available. Besides, HQSAR typically produces fast statistical correlations that are comparable in quality to 3D QSAR techniques, such as CoMFA, but avoids the time consuming step of 3D model generation and mutual alignment in 3D space [15-17, 24]. The methodology employed in HQSAR consists of some basic steps: (i) data set preparation; (ii) substructural fragmentation of the training set molecules; (iii) molecular hologram generation; (iv) statistical analysis and model generation; and, (v) test set selection and external validation [13, 15-17]. In HQSAR, each molecule is hashed to a molecular fingerprint which encodes the frequency of occurrence of various molecular fragment types using a pre-defined set of rules. To construct a molecular hologram, the fingerprint is cut into strings at a fixed interval as specified by a hologram length (HL) parameter. The strings are then aligned and the sum of each column constitutes the individual component of the molecular hologram of a particular length. The progress of incorporating information about each fragment, and each of its constituent sub-fragments, implicitly encodes 3D structural information (e.g., hybridization, chirality) [12, 25]. The final HQSAR models can be affected by a number of parameters concerning hologram generation: hologram length, fragment size and fragment distinction [12, 13, 15-17]. In our studies, holograms were generated using the standard parameters implemented in SYBYL 8.0. The models were investigated in a similar way to that described for the CoMFA models.
RESULTS AND DISCUSSION
The chemical structures and biological properties for the complete set of compounds are listed in Table 1. The values of EC50 employed in this study were measured under the same experimental conditions [19, 20], a fundamental requirement for successful QSAR studies [12, 13, 15]. The generation of reliable statistical models is dependent on the creation of appropriate training and test sets. From the original data set of 20 LXR modulators, 16 ligands were selected as members of the training set for model construction (1-16, Table 1) and the remaining 4 compounds (17-20, Table 1) were defined as members of the test set for external model validation. Hierarchical cluster analyses performed with Tsar 3D (Accelrys, San Diego, USA) was used as previously described to guide an appropriate compound selection [12,15,17]. Training and test sets were selected in such a way that structurally diverse molecules possessing activities of a wide range were included in both sets. Thus, the data set is appropriate for the purpose of QSAR model development. The same training and test sets were employed for all 2D and 3D QSAR analyses. The EC50 values were converted to the corresponding pEC50 (-logEC50) and used as dependent variables in the QSAR investigations.
Chemical Structures and EC50Values for the Series of LXR Ligands Studied
 |
CoMFA Analyses
Fig. (1) shows the alignment obtained from the docking simulations performed for the complete set of LXR ligands. As can be seen, the data set molecules presented a unique molecular alignment, indicating the robustness of the method employed using the program GOLD. From the 3D molecular alignment obtained for the training set molecules, several PLS analyses were carried out and the statistical results obtained are presented in Table 2.
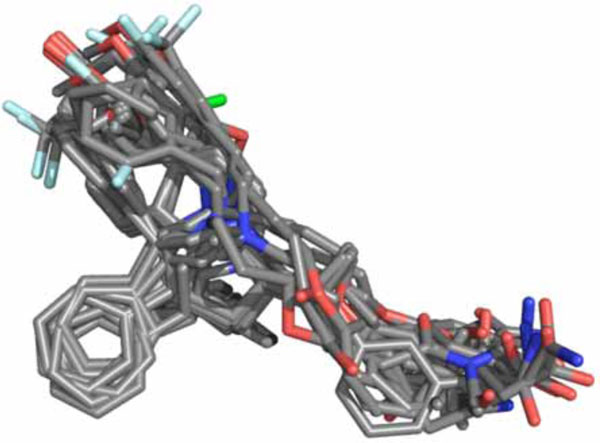 |
Fig. (1). Three-dimensional data set alignment for conformations generated by GOLD 3.1. |
From Table 2, it can be seen that an initial analysis without applying the option ‘‘region focusing’’ (an advanced method of noise reduction) produced a non-significant q2 value of 0.39. Thus, we have applied the region focusing that was weighted by S.D. x coefficient values ranging from 0.3 to 1.2, with a grid spacing ranging from 0.5 to 1.5. The best statistical results (r2 = 0.98, q2 = 0.69) among all models were obtained with the region focusing weighted by a S.D. x coefficient values of 0.8 and a grid spacing of 1.0. The region focusing not only increased q2 values during the process of model generation, but also resulted in the refinement of contour maps. In order to check the reliability of the PLS models to small systematic perturbations of the response variable, we have used the progressive scrambling method [26], which is a nonparametric approach that does not disturb the underlying covariance structure of the data, being used to determine the sensitivity of the QSAR models to chance correlations. The results further confirmed consistency of the models as defined by the critical slope, and optimum statistics for cSDEP and Q**2 obtained at the end of different runs.
The predictive ability of the most significant CoMFA model derived for the training set molecules was assessed by using a test set of molecules (compounds 17-20, Table 1). The results of the external validation procedure employing the test set compounds are listed in Table 3, and the graphic results for the experimental versus predicted activities of both training set and test set are displayed in Fig. (2).
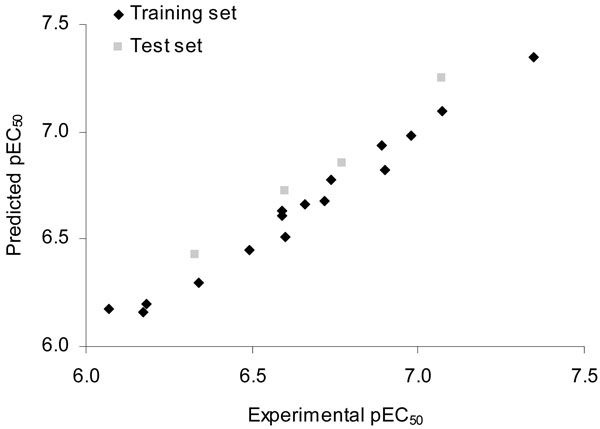 |
Fig. (2). Plot of predicted versus experimental values of pEC50 for the LXR ligands (training and test sets) by using the CoMFA method. |
Statistical Results for the CoMFA Analyses
| Model | Statistical Parameters | ||
| r2 | q2 | N | |
| No focusing | 0.97 | 0.39 | 3 |
| W = 0.8, d = 1.0* | 0.98 | 0.69 | 3 |
*Region focusing was weighted by standard deviation coefficient values (w) and grid spacing (d). Noncross-validated correlation coefficient (r2); cross-validated correlation coefficient (q2); optimal number of components (N).
Experimental and Predicted Activities (pEC50) with Residual Values for a Series of LXR Ligands by Using the HQSAR and CoMFA Methods
| Ligands | pEC50 | ||||
| Experimental | Predicted CoMFA | Residual | Predicted HQSAR | Residual | |
| 1 | 6.34 | 6.3 | -0.04 | 6.36 | 0.02 |
| 2 | 6.17 | 6.16 | -0.01 | 6.14 | -0.03 |
| 3 | 6.49 | 6.45 | -0.04 | 6.53 | 0.04 |
| 4 | 6.89 | 6.94 | 0.05 | 6.8 | -0.09 |
| 5 | 6.66 | 6.67 | 0.01 | 6.71 | 0.05 |
| 6 | 6.74 | 6.78 | 0.04 | 6.77 | 0.03 |
| 7 | 6.98 | 6.98 | 0 | 6.96 | -0.02 |
| 8 | 6.59 | 6.63 | 0.04 | 6.59 | 0 |
| 9 | 6.59 | 6.61 | 0.02 | 6.57 | -0.02 |
| 10 | 6.07 | 6.17 | 0.1 | 6.09 | 0.02 |
| 11 | 6.18 | 6.2 | 0.02 | 6.14 | -0.04 |
| 12 | 6.6 | 6.51 | -0.09 | 6.63 | 0.03 |
| 13 | 7.07 | 7.1 | 0.03 | 7.05 | -0.02 |
| 14 | 7.35 | 7.35 | 0 | 7.37 | 0.02 |
| 15 | 6.9 | 6.82 | -0.08 | 6.89 | -0.01 |
| 16 | 6.72 | 6.68 | -0.04 | 6.74 | 0.02 |
| 17 | 6.6 | 6.72 | 0.12 | 6.67 | 0.07 |
| 18 | 6.77 | 6.85 | 0.08 | 6.7 | -0.07 |
| 19 | 6.33 | 6.43 | 0.1 | 6.48 | 0.15 |
| 20 | 7.07 | 7.25 | 0.18 | 7.15 | 0.08 |
The good agreement between experimental and predicted values for the test set compounds indicates the reliability of the constructed CoMFA model (Table 3 and Fig. 2). The predicted pEC50 values for the test set compounds fall close to the experimental values, not deviating by more than 0.18 log units. No outliers were detected in this series of compounds. From the low residual values, it can be seen that the CoMFA model obtained is highly reliable and can thus be used to predict the biological activity of novel compounds within this structural diversity.
In CoMFA methodology, visualization of the steric and electrostatic interaction fields is an essential tool to guide further SAR studies aimed at the design of new molecules with improved properties, using an association of medicinal chemistry knowledge with expertise in synthetic chemistry. Fig. (3) displays the CoMFA PLS S.D. x coefficient contour maps for the steric and electrostatic fields employing the most potent LXR ligand of the series (compound 14, pEC50 = 7.35). CoMFA contour maps can be analyzed considering two main aspects: (i) steric, where favorable and unfavorable regions are represented in green and yellow; (ii) electrostatic, where red contours represent regions in which electronegative substituents may increase the biological activity, and blue contours indicate regions in which electropositive groups would contribute to enhance the activity
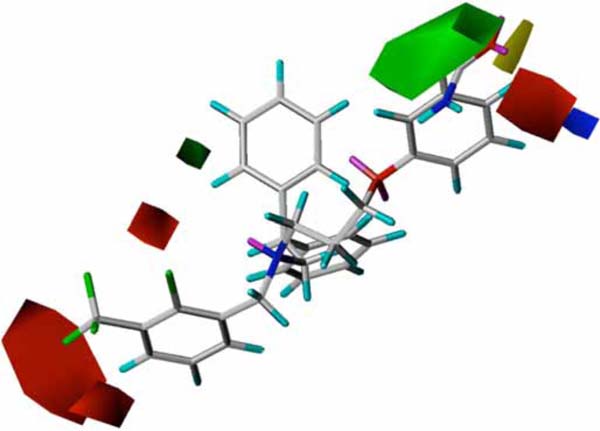 |
Fig. (3). CoMFA steric (green and yellow) and electrostatic (red and blue) contour maps. The most potent LXR modulator (14) of the series is shown in the background. |
According to the CoMFA/PLS analysis, the steric and electrostatic field properties contribute in a 47/53 ratio to the total variance, respectively. As it can be seen in Fig. (3),electronegative groups surrounding the phenyl rings of the phenoxypropanamine and phenylmethanamine side chains are related to improved potency. In addition, the favorable steric contours suggest that aromatic bulky groups at the diphenylethanamine side chain may increase ligand potency. The understanding of the molecular determinants for ligand binding and affinity is critical in drug design. In cases where the crystal structure of a target protein in complex with a ligand is available, the strategy of combining the information of the 3D contour maps with the protein structure environment can be useful to investigate the role of the intermolecular interactions related to biological activity. Fig. (4) displays an example of this integrated approach, where it can be visualized the predicted binding interactions in the formation of the complex between the most potent LXR ligand of the series (14) and the LXR ligand-binding site. The 3D QSAR models generated in this study are compatible with the 3D protein environment in the LXR binding site, as also depicted in Fig. (4). The importance of the electronegative substituents in the phenylmethanamine moiety corroborates with the interaction between this group and a positively charged residue (His435) [22]. Furthermore, the role of the hydrophobic interactions with Ile309 and Met312 side chains is also in good agreement with previous results [22, 27]. This suggests that these models can be useful in the structure-based drug design of novel structurally related LXR ligands.
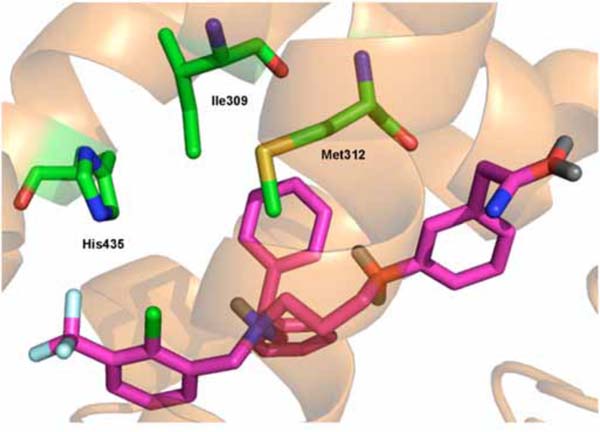 |
Fig. (4). Binding mode predicted for the most potent modulator (14, colored in pink) of the data set into the crystal structure of LXR. Important amino acid residues of the ligand-binding site are represented in green. |
HQSAR Analyses
The generation of molecular fragments was carried out using the following fragment distinctions: atoms (A), bonds (B), connections (C), hydrogen atoms (H), chirality (Ch), and donor and acceptor (DA). In order to assess the process of hologram generation, several combinations of these parameters were considered during the QSAR modeling runs. The HQSAR analyses were performed by screening the 12 default series of hologram length values ranging from 53 to 401 bins. The patterns of fragment counts from the data set compounds were related to the experimental biological activity using the PLS analysis. The statistical results from the PLS analyses using several fragment distinction combinations and the fragment size default (4-7) are summarized in Table 4.
HQSAR Analyses for Various Fragment Distinction on the Key Statistical Parameters Using Fragment Size Default (4-7)
| Model | Fragment Distinction | r2 | SEE | q2LOO | SEP | HL | N |
| 1 | A/B/C | 0.97 | 0.08 | 0.70 | 0.25 | 151 | 6 |
| 2 | A/B/C/H | 0.87 | 0.15 | 0.55 | 0.27 | 257 | 4 |
| 3 | A/B/C/H/Ch | 0.96 | 0.09 | 0.65 | 0.27 | 71 | 6 |
| 4 | A/B/C/H/Ch/DA | 0.97 | 0.07 | 0.56 | 0.30 | 53 | 6 |
| 5 | A/B/C/Ch | 0.99 | 0.04 | 0.74 | 0.23 | 59 | 6 |
| 6 | A/B/C/Ch/DA | 0.98 | 0.06 | 0.71 | 0.24 | 61 | 6 |
q2LOO, leave-on-out cross-validated correlation coefficient; SEP, cross-validated standard error; r2, noncross-validated correlation coefficient; SEE, noncross-validated standard error; HL, hologram length; N, optimal number of components. Fragment Distinction: A, atoms; B, bonds; C, connections; H, hydrogen atoms; Ch, chirality; DA,donor and acceptor.
According to Table 4, the best statistical results among all models were obtained for model 5 (r2 = 0.99 and q2 = 0.74). This model was derived using a combination of A, B, C and Ch, with 6 being the optimum number of PLS components. The influence of different fragment sizes in the statistical parameters was further investigated for this HQSAR model. Fragment size parameters control the minimum and maximum length of fragments to be included in the hologram fingerprint, and can be varied to incorporate larger or smaller fragments [28, 29]. The HQSAR results for a variety of different fragment sizes are shown in Table 5. The variation of fragment size provided substantial improvements in the statistical parameters, as can be observed for the model with fragment size 3-6, which presents high correlation coefficients (r2 = 0.99 and q2 = 0.85) associated to low standard errors.
Statistical Results for the CoMFA Analyses
| Fragment Size | r2 | SEE | q2LOO | SEP | HL | N |
| 2-5 | 0.98 | 0.06 | 0.70 | 0.25 | 61 | 6 |
| 3-6 | 0.99 | 0.05 | 0.85 | 0.18 | 53 | 6 |
| 4-7 | 0.99 | 0.04 | 0.74 | 0.23 | 59 | 6 |
| 5-8 | 0.99 | 0.04 | 0.64 | 0.27 | 59 | 6 |
| 6-9 | 0.99 | 0.03 | 0.60 | 0.29 | 401 | 6 |
q2 LOO, leave-on-out cross-validated correlation coefficient; SEP, cross-validated standard error; r2, noncross-validated correlation coefficient; SEE, noncross-validated standard error; HL, hologram length; N, optimal number of components. Fragment Distinction: A, atoms; B, bonds; C, connections; H, hydrogen atoms; Ch, chirality; DA,donor and acceptor.
In terms of validation of a QSAR model, a measure of internal consistency is available in the form of q2. However, the most important test of a QSAR model is its ability to predict the property value for new compounds. As the structure encoded in a 2D fingerprint is directly related to the biological activity of series of molecules, HQSAR models should be able to predict the activity of new structurally related LXR ligands from their fingerprints. Thus, the predictive power of the best HQSAR model derived using the training set molecules (fragment distinction A/B/C/Ch; fragment size 3-6, Table 5) was assessed by predicting pEC50 values for the test set compounds (17-20, Table 1). The external validation process can be considered the most valuable validation method, as these compounds are completely excluded during the training of the model. For simplification, the results are also listed in Table 3 and the graphic results for the experimental versus predicted activities of both training and test sets are displayed in Fig. (5).
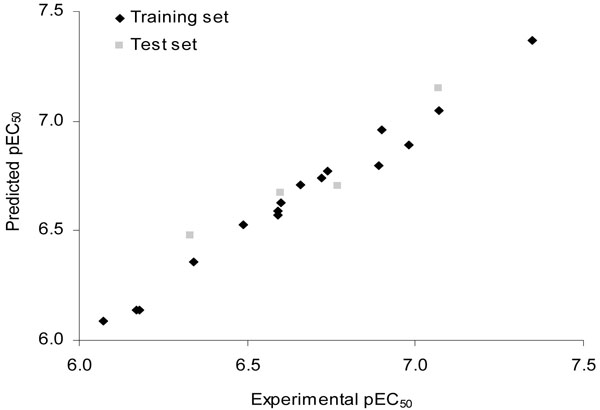 |
Fig. (5). Plot of predicted versus experimental values of pEC50 for all LXR ligands (training and test sets) by using the HQSAR method. |
The results show that the test set compounds, which represent the different structural properties incorporated within the training set, are well predicted without any outliers. From the low residual values, it can be seen that the HQSAR model obtained is highly reliable and can be used in further medicinal chemistry studies. The predicted values fall very close to the experimental pEC50 values, deviating by less than 0.15 log units.
Besides predicting the potency of LXR ligands, an HQSAR analysis provides important hints about what molecular fragments are directly related to biological activity. In the HQSAR method, it is possible to visualize the individual contributions to activity of each atom in a given molecule of the data set through the generation of contribution maps. The HQSAR module implemented in SYBYL 8.0 uses a color code in order to discriminate the main atomic contributions to activity. The colors at the red end of the spectrum (red, red orange and orange) reflect poor contributions, whereas colors at the green end (yellow, green blue and green) reflect favorable contributions. Atoms with intermediate contributions are colored white. The individual atomic contributions for the most potent compound of the data set (14) are presented in Fig. (6). In particular, the molecular fragments represented by the phenyl ring of the phenoxypropanamine side chain and the chloro group attached to the aromatic ring at the orto-position, are indicated to be strongly related to biological potency. Moreover, in any molecule, regions with intermediate or poor contributions can be identified as potential targets for molecular modification and further SAR studies. In this case, the main region that negatively contributes for biological activity is the methyl group linked to the tertiary amine, which could be replaced by another moiety with different spatial and physicochemical features in order to increase affinity and potency.
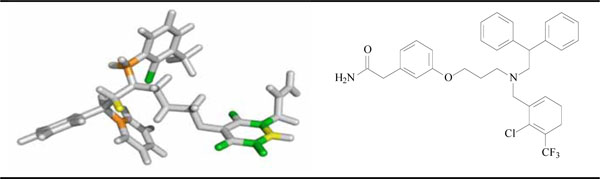 |
Fig. (6). Individual atomic contributions obtained from the HQSAR model for the most potent LXR ligand of the series (compound 14). |
CONCLUSIONS
The 3D and 2D QSAR statistical models described in this work show both good internal and external consistency, and represent important contribution to the QSAR field in the area of NRs. The good correlation between experimental and predicted pEC50 values for the test set compounds further proved the reliability of the constructed QSAR models. It is worth noting that we have employed the same training and test sets for all QSAR analyses, and the results showed that investigations can be carried out concomitantly to search for synergies between 3D and 2D QSAR technologies. Moreover, the 3D QSAR models generated are compatible with the 3D protein environment in the LXR binding-site. From the CoMFA steric and electrostatic contour maps we can conclude that electronegative groups surrounding the phenyl rings of the phenoxypropanamine and phenylmethanamine side chains are related to improved potency. In addition, the favorable steric contours suggest that aromatic bulky groups at the diphenylethanamine side chain may increase ligand potency. Regarding the HQSAR results, it was possible to obtain important hints about what molecular fragments are directly related to biological activity, i.e. the molecular fragments represented by the phenyl ring of the phenoxypropanamine side chain and the chloro group attached to the aromatic ring at the orto-position, are strongly related to biological potency. Besides, the main region that negatively contributes for biological activity is the methyl group linked to a tertiary amine, which could be replaced by another moiety with different spatial and physicochemical features in order to increase potency. The CoMFA and HQSAR models and the information obtained from the 3D contour and 2D contribution maps should be useful for the design of new structurally related LXR activators having improved affinity and potency. The integration of 3D and 2D QSAR methods is a powerful tool in medicinal chemistry and drug design studies.
ACKNOWLEDGEMENTS
We gratefully acknowledge financial support from FAPESP (The State of São Paulo Research Foundation) and CNPq (The National Council for Scientific and Technological Development), Brazil.